# Sales analysis: a worked example by month, product, region and customer
> How to analyze sales data step by step on a real-looking quarter of orders: the four questions, every answer, the Excel and Google Sheets formulas, three mistakes that skew the numbers, and asking an AI agent across orders and customers.
Source: https://datatomcp.com/guides/sales-data-analysis · By Killian · Updated 2026-11-04
A sales analysis answers four questions from your sales data: **how much did we sell over time, what sold, where, and to whom**. In practice that means revenue by month, by product, by region (or segment) and by customer, each compared with the period before, plus a few checks that the numbers are right: returns netted out, every order matched to a customer, customers counted once. Below is a worked example on a real-looking quarter of orders, with every answer, the spreadsheet formulas, three mistakes that skew the numbers, and how to ask an AI agent the same questions across two sheets.
## The example data
A small coffee wholesaler's third quarter (July to September 2026), in two sheets:
**Orders**: one row per order line (39 rows), exported from the shop or invoicing tool. Columns `order_id`, `date`, `month`, `customer_id`, `product`, `quantity`, `unit_price`, `amount`. Two rows are returns, with a negative quantity and amount.
**Customers**: one row per customer (8 rows). Columns `customer_id`, `name`, `region`, `segment`. Region is North, South or West; segment is Café, Office or Retail.
See all 39 orders rows
| order_id | date | month | customer_id | product | quantity | unit_price | amount |
|---|---|---|---|---|---:|---:|---:|
| 1001 | 2026-07-02 | 2026-07 | C02 | Espresso beans 1kg | 25 | 24 | 600 |
| 1002 | 2026-07-02 | 2026-07 | C05 | Espresso beans 1kg | 10 | 24 | 240 |
| 1003 | 2026-07-03 | 2026-07 | C01 | Espresso beans 1kg | 25 | 24 | 600 |
| 1004 | 2026-07-03 | 2026-07 | C01 | Filter beans 1kg | 5 | 20 | 100 |
| 1005 | 2026-07-05 | 2026-07 | C04 | Espresso beans 1kg | 15 | 24 | 360 |
| 1006 | 2026-07-18 | 2026-07 | C03 | Espresso beans 1kg | 5 | 24 | 120 |
| 1007 | 2026-07-19 | 2026-07 | C01 | Filter beans 1kg | 10 | 20 | 200 |
| 1008 | 2026-07-19 | 2026-07 | C02 | Filter beans 1kg | 5 | 20 | 100 |
| 1009 | 2026-07-21 | 2026-07 | C05 | Espresso beans 1kg | 20 | 24 | 480 |
| 1010 | 2026-07-27 | 2026-07 | C04 | Filter beans 1kg | 20 | 20 | 400 |
| 1011 | 2026-07-31 | 2026-07 | C03 | Decaf beans 1kg | 5 | 22 | 110 |
| 1012 | 2026-08-03 | 2026-08 | C08 | Filter beans 1kg | 25 | 20 | 500 |
| 1013 | 2026-08-04 | 2026-08 | C03 | Filter beans 1kg | 5 | 20 | 100 |
| 1014 | 2026-08-05 | 2026-08 | C04 | Espresso beans 1kg | 10 | 24 | 240 |
| 1015 | 2026-08-11 | 2026-08 | C06 | Filter beans 1kg | 10 | 20 | 200 |
| 1016 | 2026-08-14 | 2026-08 | C04 | Filter beans 1kg | −5 | 20 | −100 |
| 1017 | 2026-08-16 | 2026-08 | C03 | Decaf beans 1kg | 10 | 22 | 220 |
| 1018 | 2026-08-19 | 2026-08 | C01 | Decaf beans 1kg | 5 | 22 | 110 |
| 1019 | 2026-08-19 | 2026-08 | C04 | Decaf beans 1kg | 15 | 22 | 330 |
| 1020 | 2026-08-22 | 2026-08 | C04 | Filter beans 1kg | 15 | 20 | 300 |
| 1021 | 2026-08-23 | 2026-08 | C05 | Espresso beans 1kg | 25 | 24 | 600 |
| 1022 | 2026-08-24 | 2026-08 | C02 | Filter beans 1kg | 10 | 20 | 200 |
| 1023 | 2026-08-26 | 2026-08 | C05 | Filter beans 1kg | 20 | 20 | 400 |
| 1024 | 2026-08-26 | 2026-08 | C08 | Espresso beans 1kg | 10 | 24 | 240 |
| 1025 | 2026-09-03 | 2026-09 | C06 | Espresso beans 1kg | 15 | 24 | 360 |
| 1026 | 2026-09-05 | 2026-09 | C01 | Espresso beans 1kg | 10 | 24 | 240 |
| 1027 | 2026-09-05 | 2026-09 | C07 | Burr grinder | 1 | 180 | 180 |
| 1028 | 2026-09-08 | 2026-09 | C01 | Espresso beans 1kg | 25 | 24 | 600 |
| 1029 | 2026-09-09 | 2026-09 | C01 | Decaf beans 1kg | 10 | 22 | 220 |
| 1030 | 2026-09-09 | 2026-09 | C01 | Filter beans 1kg | 20 | 20 | 400 |
| 1031 | 2026-09-12 | 2026-09 | C02 | Espresso beans 1kg | 20 | 24 | 480 |
| 1032 | 2026-09-12 | 2026-09 | C03 | Filter beans 1kg | 25 | 20 | 500 |
| 1033 | 2026-09-20 | 2026-09 | C01 | Filter beans 1kg | 10 | 20 | 200 |
| 1034 | 2026-09-22 | 2026-09 | C05 | Burr grinder | 1 | 180 | 180 |
| 1035 | 2026-09-23 | 2026-09 | C05 | Espresso beans 1kg | 10 | 24 | 240 |
| 1036 | 2026-09-27 | 2026-09 | C02 | Filter beans 1kg | 25 | 20 | 500 |
| 1037 | 2026-09-27 | 2026-09 | C09 | Espresso beans 1kg | 20 | 24 | 480 |
| 1038 | 2026-09-29 | 2026-09 | C01 | Espresso beans 1kg | 10 | 24 | 240 |
| 1039 | 2026-09-29 | 2026-09 | C05 | Burr grinder | −1 | 180 | −180 |
The Customers sheet:
| customer_id | name | region | segment |
|---|---|---|---|
| C01 | Morning Cup | North | Café |
| C02 | Bean There | North | Café |
| C03 | Harbour Office | West | Office |
| C04 | Corner Deli | South | Retail |
| C05 | Studio Nine | West | Office |
| C06 | Little Roast | South | Café |
| C07 | Green Grocer | South | Retail |
| C08 | Tower Works | North | Office |
Made-up data, small enough to check by hand. Order 1037 comes from C09, a new customer who isn't in the Customers sheet yet; that happens in every real export and matters below.
## The four questions, answered
All totals are net of returns: 11,570 of sales minus 280 of returns gives **11,290 of net revenue** for the quarter.
**1. Over time: revenue by month**
| Month | Revenue | Order lines | Customers who ordered |
|---|---:|---:|---:|
| 2026-07 | 3,310 | 11 | 5 |
| 2026-08 | 3,340 | 13 | 7 |
| 2026-09 | 4,640 | 15 | 7 |
| **Q3** | **11,290** | **39** | **9** |
August was flat (+0.9% on July); September grew 38.9% on August (+1,300). Question 3 shows where that came from.
**2. What sold: revenue by product**
| Product | Revenue | Share | Units (net) |
|---|---:|---:|---:|
| Espresso beans 1kg | 6,120 | 54.2% | 255 kg |
| Filter beans 1kg | 4,000 | 35.4% | 200 kg |
| Decaf beans 1kg | 990 | 8.8% | 45 kg |
| Burr grinder | 180 | 1.6% | 1 unit |
Two products make almost 90% of revenue. A line with a high return rate (the grinder: 1 of 2 came back) is worth a look even when its revenue is small.
**3. Where: revenue by region, and what changed in September**
| Region | Jul | Aug | Sep | Q3 | Customers |
|---|---:|---:|---:|---:|---:|
| North | 1,600 | 1,050 | 2,880 | 5,530 | 3 |
| West | 950 | 1,320 | 740 | 3,010 | 2 |
| South | 760 | 970 | 540 | 2,270 | 3 |
| Not in Customers | | | 480 | 480 | 1 |
| **Total** | **3,310** | **3,340** | **4,640** | **11,290** | **9** |
September's +1,300 is North +1,830 and the new customer +480, against West −580 and South −430. So the growth is one region (mostly Morning Cup: six order lines and 1,900 in September) plus one new account, while the two other regions fell. By segment: Café 5,350, Office 3,750, Retail 1,710, plus the 480 not yet in Customers.
**4. To whom: top 5 customers**
| Customer | Revenue | Share |
|---|---:|---:|
| Morning Cup | 2,910 | 25.8% |
| Studio Nine | 1,960 | 17.4% |
| Bean There | 1,880 | 16.7% |
| Corner Deli | 1,530 | 13.6% |
| Harbour Office | 1,050 | 9.3% |
| **Top 5** | **9,330** | **82.6%** |
Five of nine customers bring 82.6% of revenue, and one brings a quarter. That's the concentration risk to watch: losing Morning Cup would cost more than all of South.
## The formulas in Excel or Google Sheets
With the orders on a sheet called `Orders` (month in column C, customer in D, product in E, amount in H):
- **Revenue by month** (next to a list of months in column A): `=SUMIFS(Orders!$H:$H, Orders!$C:$C, $A2)`. The same with column E gives revenue by product. A pivot table (rows: month, values: SUM of amount) does both in one go.
- **Region on each order**: add a column to Orders with `=XLOOKUP(D2, Customers!$A:$A, Customers!$C:$C, "Not in Customers")`, then pivot on it. The fourth argument matters (mistake 3).
- **Customers in a period**: Google Sheets `=COUNTUNIQUE(FILTER(Orders!$D:$D, Orders!$C:$C=$A2))`; Excel 365 `=ROWS(UNIQUE(FILTER(Orders!$D:$D, Orders!$C:$C=$A2)))`.
- **Share**: each line's revenue divided by the total, formatted as a percentage.
Keep `month` as text such as `2026-07`, so grouping and lookups match exactly.
## Three mistakes that skew a sales analysis
**1. Adding up customers across months.** 5 + 7 + 7 = 19 "customers" in the quarter, but only 9 different customers ordered. Most customers order in more than one month, so monthly customer counts never add up to a quarterly one. Count distinct customers over the whole period instead.
**2. Mixing returns into averages.** Average order value as net revenue ÷ all rows is 11,290 ÷ 39 = **289.49**, because the two return rows count as "orders". Sales ÷ sales rows is 11,570 ÷ 37 = **312.70**. Pick one definition, write it down, and use it every month; the difference here is 8%.
**3. Losing orders in a lookup.** A plain `VLOOKUP` returns `#N/A` for C09, and a pivot that filters out errors or blanks shows regions adding up to **10,810** instead of 11,290. The 480 doesn't disappear from the business, only from the report. Give the lookup a fallback ("Not in Customers") and check that the regional total equals the overall total.
## Ask an agent instead of rebuilding the pivots
Each new question ("and by segment?", "only North?", "who stopped ordering?") means another pivot or formula, and pasting both sheets into a chat stops working once the export has tens of thousands of lines (the [token cost calculator](/guides/spreadsheet-ai-token-cost-calculator) shows how fast a pasted sheet fills the context window). datatomcp keeps both sheets in one workspace and lets any agent (Claude, ChatGPT, Cursor, an n8n flow) query them, so the rows stay with us and only the question and the answer go through the chat.
**1. Add both sheets.** Sign in at [app.datatomcp.com](https://app.datatomcp.com/login), open **Add data**, and upload the two CSVs or paste their Google Sheets links. A Google Sheet stays in sync, so next month's orders show up without a re-upload.
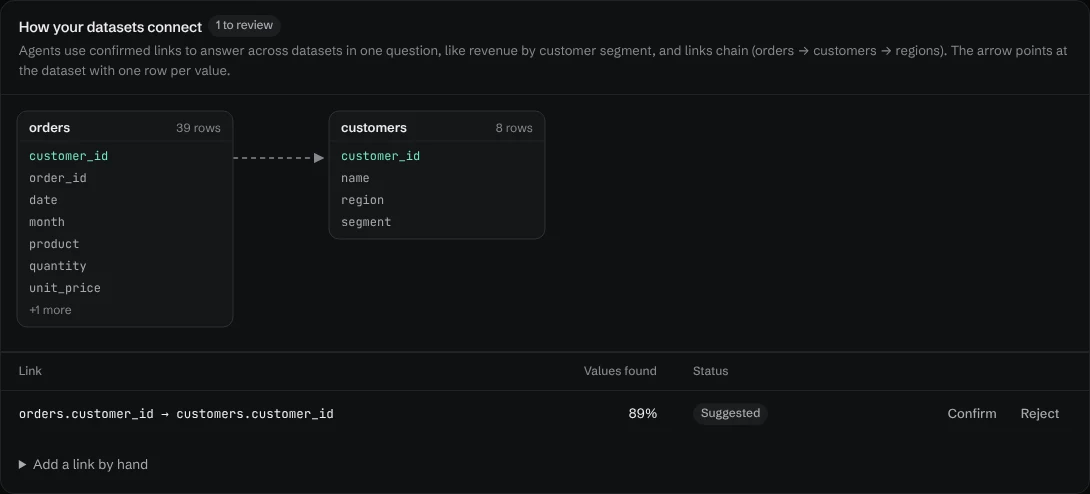
**2. Confirm the link.** datatomcp checks the columns the sheets share and finds `customer_id` in both. Because C09 isn't in Customers, 8 of the 9 customer IDs in Orders are found (89%), so the link is **suggested**, not confirmed on its own. Confirm it on the relationship map:
 **3. Connect your agent** ([any MCP client](/guides/add-remote-mcp-server), or [Claude](/guides/connect-google-sheets-to-claude) step by step) and ask in plain words.
We ran the four questions above through datatomcp's query engine on these two sheets; every table on this page is its output. Each one is a single `aggregate` call on Orders: grouped by `month`, by `product`, by `customers.region` (a column of the linked sheet) or by `customers.name`, summing `amount`. The shares and the month-on-month changes are the agent dividing two numbers.
What the results say on their own:
- **Unmatched rows are reported, not hidden.** Grouped by region, the answer carries the 480 in a blank group and says that 1 row found no match in Customers; the agent is told to mention it. That is mistake 3 caught without a check formula.
- **Customers are counted once.** "How many customers ordered in Q3?" is a distinct count on `customer_id`: 9, not 19.
- **Returns are rows like any other.** Ask for "sales only" and the agent adds a filter `amount > 0` (11,570 over 37 lines); ask for "net revenue" and it doesn't. Say which one you mean, or see the returns themselves with `query_rows` (orders 1016 and 1039).
## FAQ
**What is a sales analysis?** A review of sales data that shows how revenue changes over time and where it comes from: by product, by region or segment, and by customer. It usually compares one period with the previous one and with a target.
**How do I analyze sales data in Excel?** Put the export in one sheet, add lookups for the customer's region or segment, and build pivot tables of revenue by month, product, region and customer. Use `SUMIFS` for fixed reports and `COUNTUNIQUE` (Sheets) or `UNIQUE` (Excel 365) to count customers. Check that every breakdown adds up to the same total.
**What should a sales analysis report include?** Revenue by period with the change on the previous period, revenue by product and by region or segment with shares, the top customers with their share (concentration), returns, and any orders that couldn't be matched to a customer or product.
**Why don't my monthly customer counts add up to the quarter?** Because the same customer orders in several months. Count distinct customers over the whole quarter instead of adding monthly counts.
**Can ChatGPT or Claude analyze sales data?** Yes, if they compute the totals rather than read them. With a small file uploaded, the chat runs code and can be right. With a full export, two linked sheets or the same questions every month, connect the sheets so the agent sends a query and gets back counted totals: [how datatomcp works with Claude](/guides/connect-google-sheets-to-claude).
[Create a free account](https://app.datatomcp.com/login) and try it on your own orders and customers. Free covers 3 datasets of up to 100,000 rows each.
More: [Budget vs actual: variance formula and the double-counting trap](/guides/budget-vs-actual) · [Test an AI data tool on linked sheets](/guides/test-set-linked-sheets) · [Why AI chats get spreadsheet totals wrong](/guides/ai-spreadsheet-totals-wrong)
---
## About datatomcp
datatomcp is the AI-native data layer for teams without a data team. It makes a team's Google Sheets, CSV and Excel files AI-ready: one governed place every AI agent can ask, with exact answers computed by a database, shared definitions of what each number means, a full audit trail of agent questions, and charts. Agents connect over a remote MCP server (OAuth) or a REST API. Hosted in the EU. Facts, plans and limits: https://datatomcp.com/llms.txt. API reference: https://datatomcp.com/docs/api.